

|
🎶 What is the live music capital of the U.S.? 🎶
Austin, Texas, is America's No. 1 live music city, with an average of five concert venues per capita — plus nine music festivals planned for 2022, which is almost 2x more than the average U.S. city!
|
Best Music Cities in the U.S., Ranked | Top 15 Music Cities | How Much Do You Spend On Concert Tickets? | Best Cities by Music Genre | Data Details | Worst Music Cities | FAQ
Whether it's a sonorous trumpet solo or the streetside strum of an acoustic guitar, a city's local sound is the heartbeat that keeps it alive.
That heartbeat is still strong, despite the pandemic's impact on other industries. Streaming services saw a 26% increase in profits in early 2021, comprising nearly two-thirds ($4.6 billion) of the industry's revenue that season.[1] Meanwhile, revenue from vinyl sales increased by 94% to $467 million in just the first half of 2021. Overall, global music revenues have steadily and continuously grown over the past six years.[2]
And now that some performers and bands are going back on tour, we wanted to know: What are the best music cities in the U.S.?
To find out, we analyzed publicly available data from the U.S. Census, Bureau of Economic Analysis, Bureau of Labor Statistics, Indie on the Move, and more to rank the 50 most populous metro areas in the U.S. from the best to the worst cities for music.
Our weighted rankings evaluated criteria including:
- 6x: Google Trends scores for 20 different terms, including music genres
- 3x: Average concert ticket price (based on 2019, pre-COVID)
- 3x: Small concert venues within a 25-mile radius from the metro area's main city
- 2x: Cost of a monthly concert outing (based on the average concert ticket price divided by the city's average income)
- 2x: Music festivals scheduled for 2022 within a 100-mile radius
- 2x: Number of working musicians per 100,000 citizens
- 2x: Average wage for working musicians
Keep reading to find out if your city has made its claim to fame – or if your local music scene is out of tune!
Best Music Cities in the U.S. Stats 🎶
- Nashville, Tenn., is the music capital of the U.S., ranking No. 1 for the number of both full-time musicians per capita (127 per 100,000 residents) and intimate concert spaces per capita (6.7). Jump to section👇
- Nashville also tops the charts as the best city for working musicians. Career performers can expect to earn an average of $28.81 hourly.
- After Nashville, the top 15 cities include Indianapolis, Portland, Ore., and Austin, Texas. 👇
- It's easier to discover up-and-coming artists in our top 15 cities: They have an average of 3.9 small concert venues per capita versus 2.9 small venues per capita in the average city in our study.
- Miami is the worst overall city for music-lovers, with pricey concert tickets ($166) that exceed the average city's ticket costs ($126) by 32%. 👇
- Miami also lagged in other measures, ranking No. 49 out of 50 cities for small concert venues, with just 0.6 venues per capita. By contrast, the average city in our study has 2.9 small concert venues per 100,000 people — nearly 5x as many as Miami!
- Altogether, the 10 worst music metros offer an average of only 1.8 music venues per capita – fewer venues than 76% of all 50 metros.
- Additionally, a monthly concert ticket from one of our bottom 10 cities eats up 3.1% of a concert-goer's annual income versus 2.5% for the average city in our study.
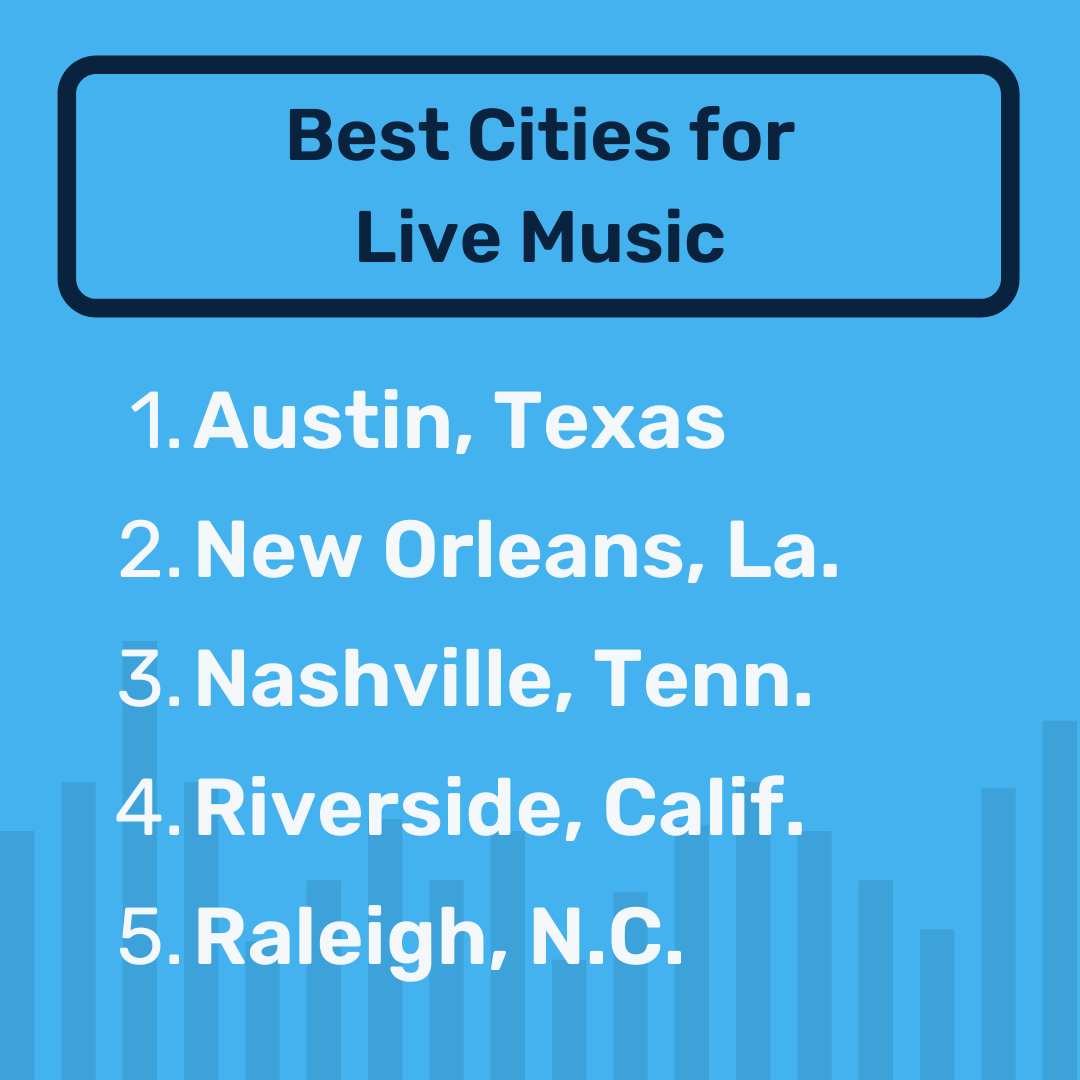
- Austin, Texas, is the best city for live music fans, with New Orleans and Nashville close behind. 👇
- With an average of 5.2 venues per capita, Austin has a 79% edge over the average city (2.9).
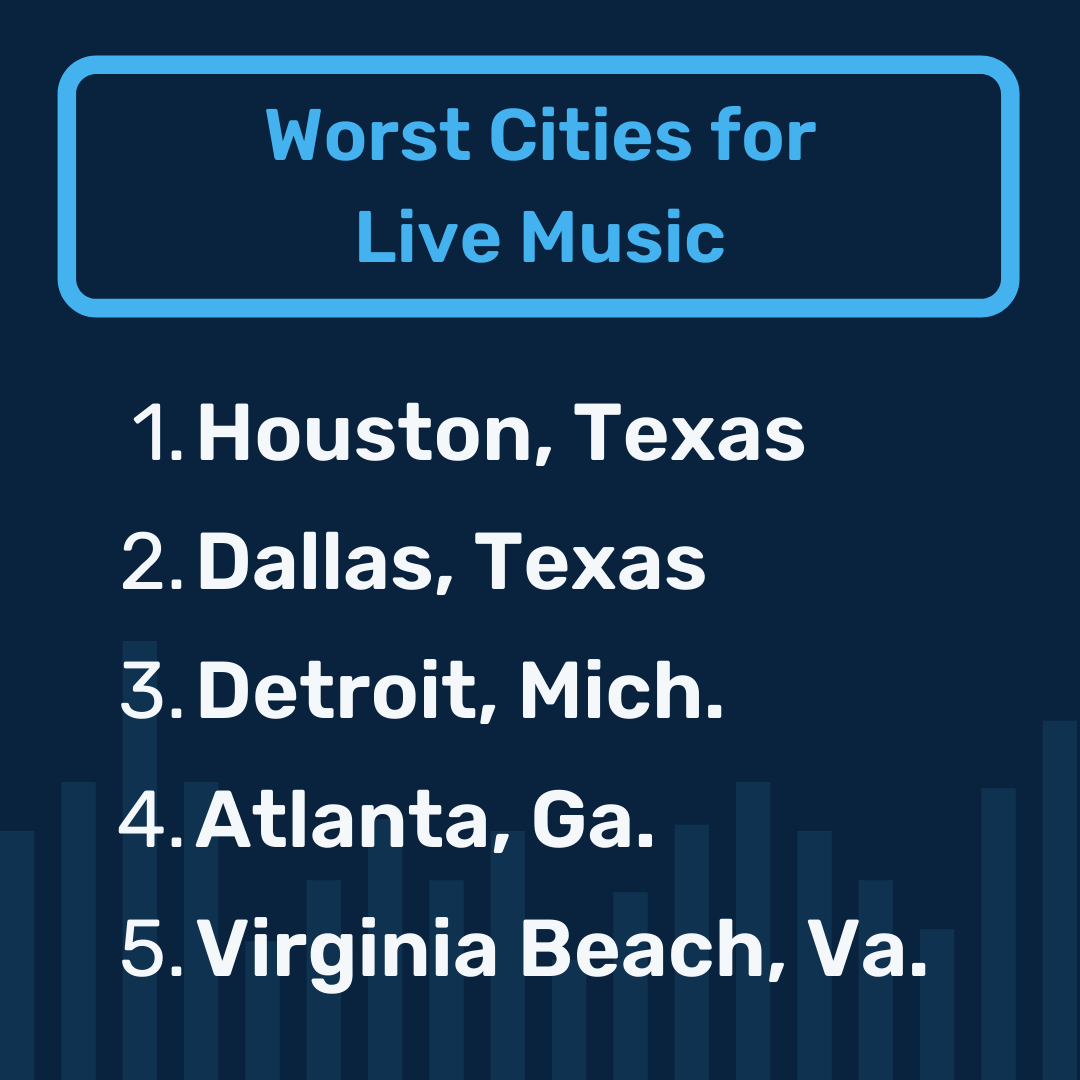
- The worst city for live music is Houston, followed by Dallas and Detroit.
- Riverside, Calif., is the best city for festival-goers, with 22 nearby music festivals planned for 2022.
- Fans of specific music genres are drawn to cities that have a lively local scene:
- 🎸 Rock: Louisville, Ky.
- 🤠 Country: Nashville, Tenn.
- 🎛 Hip-hop: Baltimore, Md.
- 🤖 Electronic: Boston, Mass.
- 💃🏽 Dance: Salt Lake City, Utah
- 💙 Blues: St. Louis, Mo.
- 🎤 Rap: Memphis, Tenn.
- 🎷 Soul: Richmond, Va.
The 50 Best Music Cities, Ranked
| Rank | City | No. Small Venues per Capita | Avg. Concert Ticket Price | % of Income Spent on Monthly Concert | Avg. Annual Cost of Monthly Concert | No. of Career Musicians per Capita | Musicians' Median Hourly Wage | No. of Festivals (2022) |
|---|---|---|---|---|---|---|---|---|
| – | Nat. Avg. | 2.9 | $126 | 2.5% | $1,613 | 28 | $31.92 | 5 |
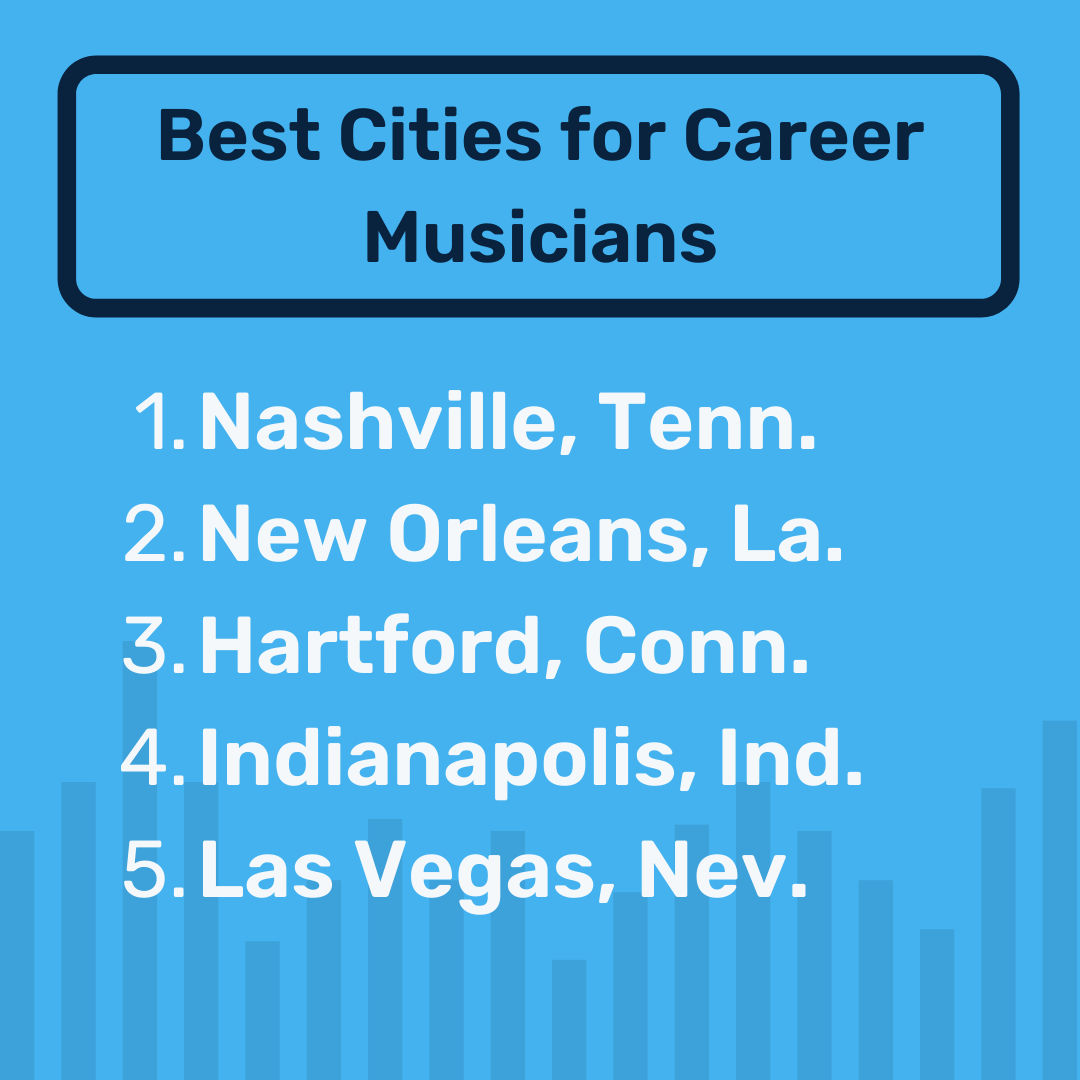
| 1 | Nashville, TN | 6.7 | $130 | 2.5% | $1,560 | 127 | $28.81 | 3 |
| 2 | Indianapolis, IN | 5.3 | $99 | 1.9% | $1,188 | 34 | $31.40 | 1 |
| 3 | Portland, OR | 3.7 | $105 | 2.0% | $1,260 | 38 | $27.45 | 9 |
| 4 | Austin, TX | 5.2 | $111 | 2.1% | $1,332 | 22 | $20.29 | 9 |
| 5 | Raleigh, NC | 5.9 | $104 | 2.1% | $1,248 | 8 | $17.86 | 4 |
| 6 | Salt Lake City, UT | 3.7 | $122 | 2.5% | $1,464 | 25 | $21.09 | 1 |
| 7 | St. Louis, MO-IL | 2.6 | $104 | 2.1% | $1,248 | 20 | $37.53 | 1 |
| 8 | San Francisco, CA | 2.9 | $125 | 1.4% | $1,500 | 37 | $48.84 | 9 |
| 9 | Seattle, WA | 2.9 | $126 | 1.9% | $1,512 | 53 | $32.07 | 7 |
| 10 | Buffalo, NY | 4.6 | $119 | 2.6% | $1,428 | 45 | $20.30 | 1 |
| 11 | Boston, MA | 2.5 | $126 | 1.8% | $1,512 | 32 | $31.59 | 6 |
| 12 | Charlotte, NC | 3.0 | $112 | 2.4% | $1,344 | 25 | $44.74 | 3 |
| 13 | Columbus, OH | 2.2 | $123 | 2.6% | $1,476 | 25 | $31.40 | 7 |
| 14 | Hartford, CT | 3.8 | $135 | 2.4% | $1,620 | 64 | $35.65 | 7 |
| 15 | Cincinnati, OH | 2.8 | $110 | 2.2% | $1,320 | 32 | $47.53 | 3 |
| 16 | Providence, RI | 4.3 | $104 | 2.1% | $1,248 | 38 | $23.58 | 5 |
| 17 | Virginia Beach, VA | 2.1 | $85 | 1.9% | $1,020 | 28 | $31.40 | 1 |
| 18 | Washington, DC | 1.7 | $126 | 1.9% | $1,512 | 30 | $30.80 | 5 |
| 19 | Los Angeles, CA | 1.3 | $140 | 2.4% | $1,680 | 49 | $33.22 | 17 |
| 20 | Denver, CO | 4.2 | $115 | 1.9% | $1,380 | 16 | $30.14 | 3 |
| 21 | Milwaukee, WI | 3.7 | $112 | 2.2% | $1,344 | 24 | $31.40 | 8 |
| 22 | Memphis, TN | 4.6 | $122 | 2.9% | $1,464 | 16 | $31.40 | 1 |
| 23 | Philadelphia, PA | 2.8 | $124 | 2.1% | $1,488 | 18 | $24.89 | 11 |
| 24 | Baltimore, MD | 2.8 | $121 | 2.2% | $1,452 | 33 | $19.24 | 5 |
| 25 | Chicago, IL | 1.6 | $140 | 2.5% | $1,680 | 37 | $42.59 | 8 |
| 26 | Richmond, VA | 2.9 | $90 | 1.8% | $1,080 | 16 | $24.30 | 1 |
| 27 | San Diego, CA | 2.2 | $123 | 2.2% | $1,476 | 14 | $31.40 | 5 |
| 28 | New Orleans, LA | 5.9 | $145 | 3.0% | $1,740 | 32 | $29.92 | 6 |
| 29 | Louisville, KY | 4.6 | $131 | 2.8% | $1,572 | 25 | $31.40 | 3 |
| 30 | Sacramento, CA | 2.1 | $122 | 2.4% | $1,464 | 9 | $31.90 | 6 |
| 31 | Cleveland, OH | 2.6 | $107 | 2.2% | $1,284 | 30 | $26.27 | 2 |
| 32 | Kansas City, MO | 3.0 | $121 | 2.5% | $1,452 | 30 | $27.05 | 1 |
| 33 | Riverside, CA | 0.6 | $104 | 2.8% | $1,248 | 11 | $31.40 | 22 |
| 34 | Birmingham, AL | 2.9 | $109 | 2.4% | $1,308 | 23 | $23.07 | 1 |
| 35 | Detroit, MI | 1.4 | $114 | 2.3% | $1,368 | 21 | $35.72 | 3 |
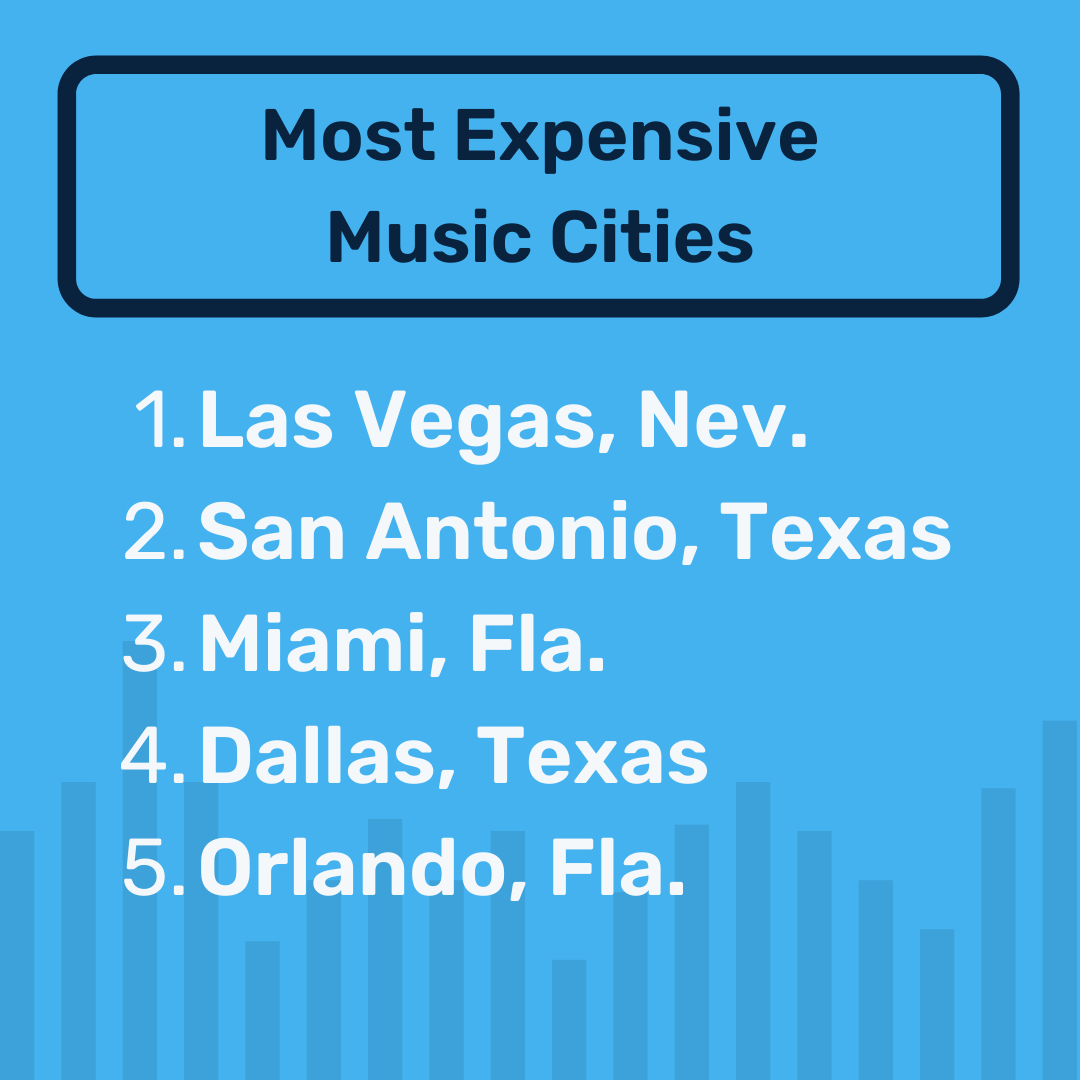
| 36 | Orlando, FL | 1.8 | $134 | 3.3% | $1,608 | 12 | $31.40 | 11 |
| 37 | Minneapolis, MN | 2.5 | $129 | 2.3% | $1,548 | 21 | $42.01 | 5 |
| 38 | Tampa, FL | 2.2 | $131 | 3.0% | $1,572 | 22 | $28.40 | 11 |
| 39 | San Jose, CA | 2.5 | $167 | 1.7% | $2,004 | 27 | $56.64 | 7 |
| 40 | Pittsburgh, PA | 2.9 | $115 | 2.2% | $1,380 | 18 | $31.40 | 1 |
| 41 | Phoenix, AZ | 1.9 | $128 | 2.9% | $1,536 | 18 | $31.40 | 5 |
| 42 | Oklahoma City, OK | 4.3 | $132 | 3.0% | $1,584 | 11 | $16.32 | 2 |
| 43 | New York, NY | 1.6 | $154 | 2.2% | $1,848 | 51 | $37.69 | 11 |
| 44 | Jacksonville, FL | 1.1 | $120 | 2.6% | $1,440 | 18 | $21.95 | 7 |
| 45 | Atlanta, GA | 1.4 | $133 | 2.7% | $1,596 | 17 | $31.40 | 3 |
| 46 | Dallas, TX | 1.5 | $158 | 3.1% | $1,896 | 9 | $41.54 | 2 |
| 47 | San Antonio, TX | 2.3 | $159 | 3.8% | $1,908 | 25 | $31.40 | 7 |
| 48 | Houston, TX | 1.1 | $142 | 2.9% | $1,704 | 14 | $43.60 | 1 |
| 49 | Las Vegas, NV | 2.3 | $206 | 4.8% | $2,472 | 22 | $52.76 | 4 |
| 50 | Miami, FL | 0.6 | $166 | 3.1% | $1,992 | 22 | $30.53 | 7 |
The 15 Best Music Cities in the U.S.

The best music cities in our study rock at combining affordability and general interest with a decent number of music events and venues.
Overall, the top 15 metros for music are playing the hits for every metric:
- Plenty of working musicians: The top 15 cities have an average of 39 professional musicians per capita – 39% higher than the average city in our study (28).
- Inexpensive concerts: Our top 15 cities have an average concert ticket price of $117 versus $126 for the average city in our study – an 8% difference.
- Lots of intimate concert venues: The top 15 cities have an average of 3.86 small concert venues per capita versus 2.90 venues per capita in the average city in our study. That’s a 50% gap!
- People searching for music genres: The top 15 cities consistently come out on top for Google Trends for all genres and rank 11% higher across every genre than the average city in our study.
How Much Do You Spend on Concert Tickets?
Want to know how much your concert tickets are costing you in any of the top 50 metro areas? Plug your info into the calculator below to find out! 👇
1. Nashville, Tennessee
| 🌟 Music Capital of the U.S.Home to 5x as many career musicians per capita (127 per 100,000 people) as the average city (28), Nashville is the No. 1 metro for music across the board. |
Although Nashville is an unmistakable hub for country music, it's not the only thing crowning Music City the music capital of America. Nashville ranks No. 2 across every genre of our Google Trends research – and No. 1 for heavy metal in addition to country.
As if ranking first for the number of small concert venues per 100,000 residents (6.7) wasn't enough, career musicians in Nashville also earn more — hourly $28.81, higher than 30% of the cities in our study. With so many venues and artists and ticket prices ($130) that beat out 32% of other metros, Nashville is THE city for music in the U.S.
» Read more stats on Tennessee
2. Indianapolis, Indiana
| 💰 Music for Your MoneyOn average, concert tickets for Indianapolis shows ($99) are cheaper than tickets in 94% of the cities in our study. One concert every month would cost the average local only 1.9% (or $1,188) of their annual income. |
As the capital of Michael Jackson's home state, Indianapolis does not disappoint. Ranking No. 4 in small concert venues per capita (5.3 per 100,000 people), Indianapolis is a great place to catch an affordable show.
Additionally, full-time musicians in Indianapolis make more hourly ($31.40) than artists in 40% of the cities in our study, and the metro ranks No. 5 in Google Trends for both alternative music and blues.
3. Portland, Oregon
|
🤑 Discount Jams
Portlanders who attend a concert every month only have to worry about spending 2% of their annual income on live music, which is an 18% discount compared to the average city (2.5%).
|
The hometown of indie rock icons such as Elliott Smith, The Decemberists, and Blitzen Trapper, the City of Roses is a muse for musical minds.
Portland music-lovers can look forward to nine different festivals planned for 2022 – 67% more than the average metro area. Additionally, with more career musicians per 100,000 residents (38) than 88% of the metros we studied, Portland remains a top city for performers.
4. Austin, Texas
| 🔊 Live Music CapitalAustin is America's No. 1 live music metro, with an average of five small concert venues per 100,000 residents and nine music festivals planned for 2022 – almost 2x more than the average U.S. city (5)! |
Although tied with Portland for the number of festivals planned for 2022, Austin has more intimate venues per capita (5.2) than 92% of other metros we analyzed.
Known for big musical gatherings such as Austin City Limits and South by Southwest (SXSW), Austin also beats other metros based on price: Average ticket prices in Austin ($111) are cheaper than 76% of the cities in our study.
5. Raleigh, North Carolina
| 💫 Showing UpWith more than twice as many concert venues per 100,000 residents (5.9) than the average city in our study (2.9), Raleigh ranks No. 2 in small concert venues per 100,000 residents. |
From the Pour House to the Lincoln Theatre, North Carolina's capital has plenty of places to catch your favorite solo act, indie band, bluegrass duo, or punk lineup. Even better, Raleigh offers cheaper ticket prices ($104) than 86% of the metros in our study and at a 17% discount compared to the average city ($126).
» Read more stats on North Carolina
6. Salt Lake City, Utah
| 🎶 Genre MastersSalt Lake City ranks No. 1 across all music genres in our Google Trends analysis. SLC residents are passionate about everything from punk to show tunes! |
An audience for any genre, Salt Lake City is a great space for musical artists. SLC is home to 25 career musicians per 100,000 people – over 50% more per capita than other metro areas – and ticket prices ($122) that run cheaper than 52% of the other cities in our study.
7. St. Louis, Missouri
| 🎸 Blues Music CapitalSTL ranks No. 1 for blues music in our Google Trends analysis and No. 4 in folk music, cementing St. Louis as a vibrant hub for the uniquely American voice in music. |
St. Louis can boast a lively blues scene thanks in large part to late blues patriarch Bennie Smith, who helped pioneer the genre's characteristic sound.[3] In addition to chart-topping blues, St. Louis residents enjoy 17% savings on the average concert ticket, spending only $104 per ticket versus $126 in the average metro area.
The Gateway City might also be a full-time musician's gateway to fame: St. Louis musicians earn more hourly ($37.53) than artists in 78% of our other metros.
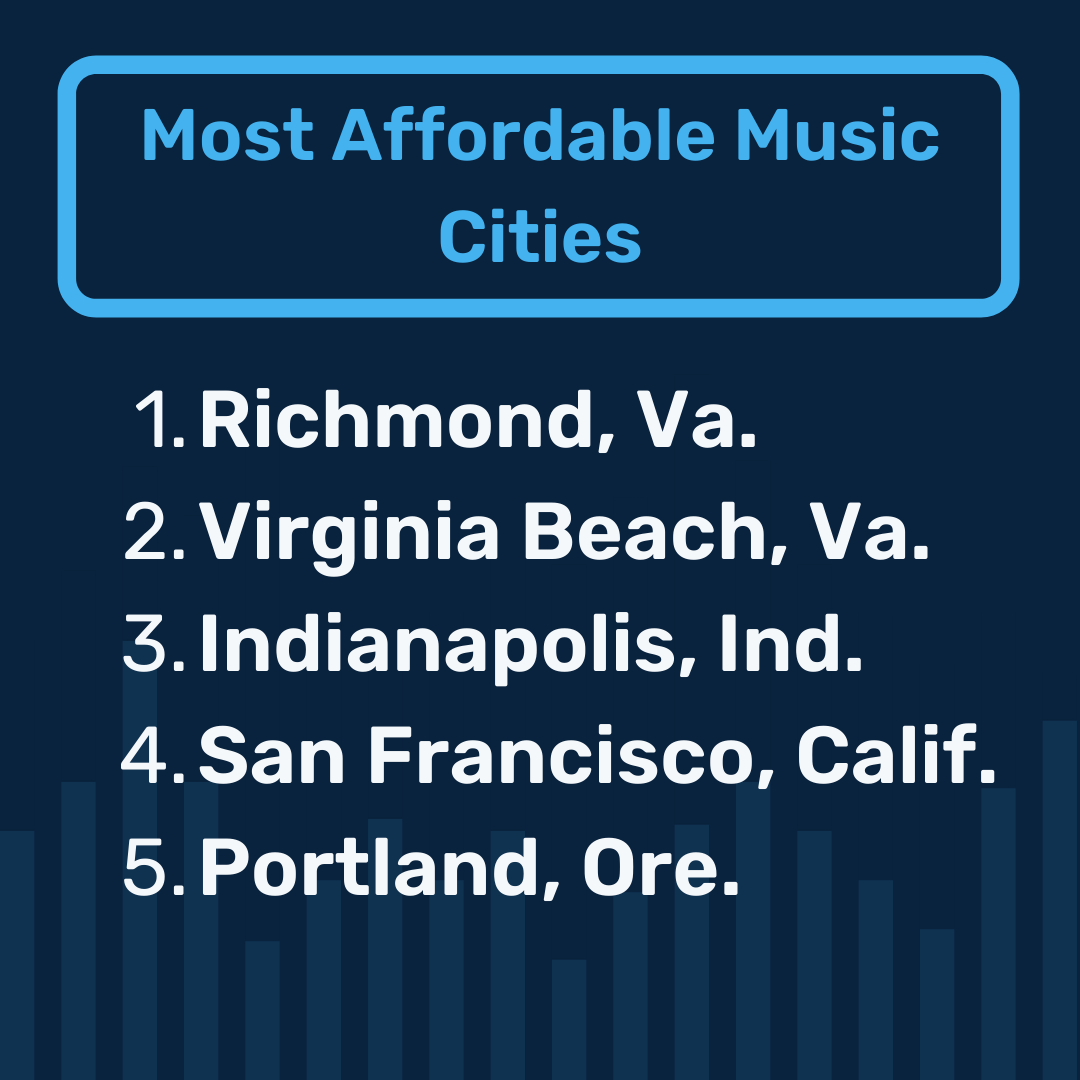
8. San Francisco, California
| 🎟 Best Ticket PricesThe Bay Area is No. 1 for concert ticket price as a percentage of income (1.4%). One concert per month in San Francisco eats up 45% less of your budget than in the average metro area (2.5%). |
Not only are shows relatively affordable compared to income in San Francisco, but there's also a great financial opportunity for artists in the metro that gave us the jazz fusion powerhouse Santana. Full-time San Francisco musicians make more hourly ($48.84) than full-time musicians working in 94% of our other cities.
With more intimate performance spaces than 66% of the cities in our study (2.9 per 100,000 people), SF is one of few cities that can boast a music scene that supports both its audience and its musicians.
» Read more stats on California
9. Seattle, Washington
| 🤘 Punk Music CapitalEmerald City tops the charts for the punk genre, ranking No. 1 for punk, No. 3 for electronic music, and No. 5 for folk in our Google Trends analysis. |
Known for the "Seattle Sound" courtesy of groups such as Tina Bell's Bam Bam, Foo Fighters, Pearl Jam, and Soundgarden, this metro ranks No. 3 for working musicians. With 53 musicians per capita, Seattle is home to 89% more artists than the average metro (28).
Local career musicians also make more than the average artist would in 90% of other cities studied. Additionally, a monthly concert ticket at average Seattle prices ($126) would eat up 1.9% of the median annual salary of a local. Compared to 2.5% across all cities, that's 23% less of a person’s budget in Seattle!
» Read more stats on Washington
10. Buffalo, New York
| 💽 Alt Music CapitalBuffalo ranks No. 1 for alternative music based on our Google Trends analysis and offers more intimate concert venues per capita (4.6 per 100,000 people) to catch your favorite acts than 88% of the metros in our study. |
Buffalo locals enjoy tons of local venues at a fraction of the cost that residents in many other cities do – Buffalo's average ticket prices ($119) are cheaper than tickets in 38% of our metros.
Additionally, there are tons of great acts to catch, as Buffalo is home to an average of 45 musicians per capita, more career musicians than 90% of other cities.
11. Boston, Massachusetts
| ⚡ Electronic Music CapitalThe City of Champions also takes the title in several music genres, ranking No. 1 for electronic music and No. 2 for both classical and holiday music. |
Not only is Boston the birthplace of iconic acts such as Pixies and The Cars, but Boston musicians can also boast higher hourly wages ($31.59) than artists in 66% of the cities in our study, making this metro a great stop for artists and fans alike.
With a better ticket price-to-income ratio (1.8%) than 94% of other metros, Bostonians can catch monthly shows at an average annual cost of $1,512, compared to an average of $1,613 or 2.5% across all 50 cities — that's a 28% discount!
» Read more stats on Massachusetts
12. Charlotte, North Carolina
| 🧑🎤 The Musician MetroCharlotte is in the top five cities for working musicians, ranking No. 3 for median musician wage, with local artists making a higher hourly wage ($44.74) than artists in 90% of the other metros in our study. |
Even relative to other professions in Charlotte, musicians here are doing incredibly well. The median hourly wage for full-time artists is 1.57 times ($44.34/hour) the median wage of all Charlotte residents ($28.34/hour).
Not only can musicians make a decent living in Charlotte, but locals can also count on catching their favorite bands at rates ($112 per ticket) that are lower than the average ticket prices in 72% of other cities.
13. Columbus, Ohio
| 🎤 Pop Music CapitalColumbus ranks No. 1 for pop music, No. 3 for rock, and No. 5 for jazz in our Google Trends analysis. |
High demand for burgeoning pop hits has driven Columbus' music scene into the top 15 music cities and has clearly fostered a love for live shows.
Known as the hometown of country-pop group Rascal Flatts, Columbus has more festivals planned for 2022 (7) than 64% of the cities in our study. And with more career musicians per capita (25 per 100,000 people) than 50% of the metros we looked at, this city is a great place for aspiring pop stars to network and perform.
14. Hartford, Connecticut
| 🎵 Lots of Local TalentThe birthplace of folk singer-songwriter Bill Morrissey, Hartford is home to more musicians per capita (64 per 100,000 people) than 98% of cities in our study – more than double the national average (28). |
Coming in second place for working musicians among metros in our study, Hartford is another great city for artists looking to make a living.
Career musicians here can expect to make an average of $35.65 per hour – more than full-time artists make in 74% of other metros. With 31% more small concert venues per capita (3.8 per 100,000 people) than the national average (2.9), Hartford musicians are set up for success.
» Read more stats on Connecticut
15. Cincinnati, Ohio
|
✨ Playing the Hits
Hometown of big names such as The National, Queen City reigns for musician pay and the number of full-time musicians: Cincinnati is home to more musicians per capita (32 per 100,000 people) than 72% of other cities while ranking No. 2 for musician pay ($29.80/hour). |
Not only are full-time musicians raking in the dough here, but they're also making more than their non-musician neighbors! The median hourly wage for a person with the job title "musician or singer" in Cincinnati is 1.6 times ($47.53/hour) the median wage of all local residents ($29.80/hour).
And for locals hoping to catch a show, you're in luck! Ticket prices for Cincinnati shows ($110) are cheaper than the average ticket price in 78% of the metros we analyzed and 13% cheaper than the national average ($126).
Best Music Cities By Genre
Data Details: Top 5 Cities by Category
When we analyzed the data by specific ranking factors, we discovered some cities hit both impressive highs and lows.
| Best 5 Music Cities | Worst 5 Music Cities |
|---|---|
 |
 |
 |
 |
 |
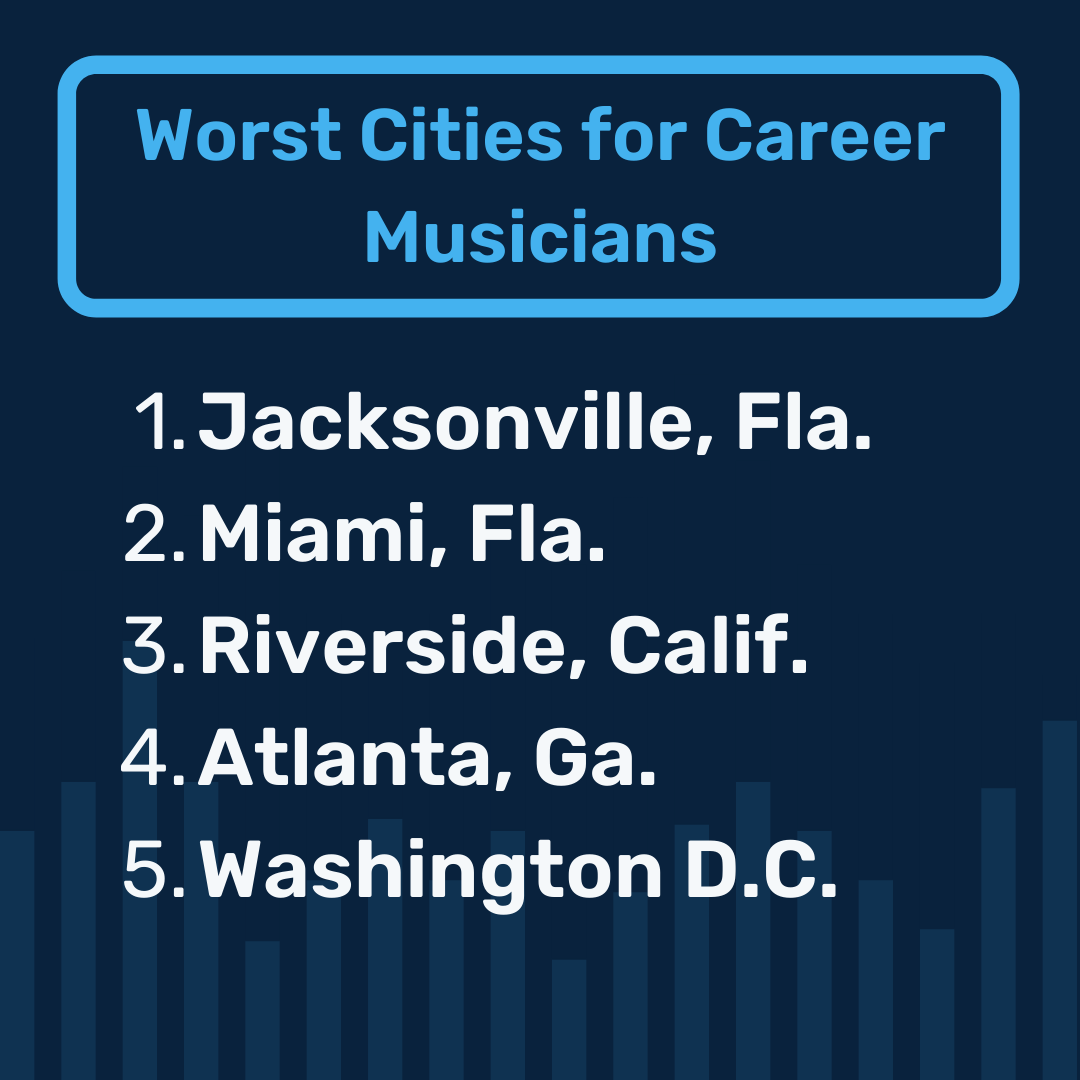 |
The 10 Worst Music Cities
Not every metro can hit the high notes, and 10 of our cities performed pretty poorly when it came to venues and events, general interest, and affordability:
- Miami, Florida
- Las Vegas, Nevada
- Houston, Texas
- San Antonio, Texas
- Dallas, Texas
- Atlanta, Georgia
- Jacksonville, Florida
- New York, New York
- Oklahoma City, Oklahoma
- Phoenix, Arizona
Although Miami has a vibrant club scene, it lacks live music. Miami ranked No. 49 out of 50 cities in our study in terms of small concert venues, with a mere 0.62 venues per capita. In comparison, the average city in our study has 2.9 concert venues per capita – an unfortunate 79% more than Miami.
Altogether, the 10 worst music cities offer an average of only 1.8 music venues per capita – 54% less than the top 15 cities (3.9 per 100,000 people).
Additionally, these cities have 25% fewer career musicians than the average city in our study, and concert tickets are priced 19% higher ($150) than the average city ($126). The bottom 10 cities consistently come out in the bottom ranks in Google Trends across all genres.
It's clear that folks living in these 10 cities aren't as interested in music experiences as the residents of other metros. Compared to the average city in our study, the bottom 10 cities have 7% lower Google Trends scores across all genres.
Methodology
Clever Real Estate compared the 50 most populous U.S. metro areas across a number of metrics, listed below. Each metric was normalized and then graded on a 100-point scale. The combined weighted average of the scores determined the "music city" score upon which the final ranking was based.
In cases where data sets included only cities or other statistical areas, the city data was combined and weighted by population within the overall metro in which the city belonged to the extent of the available data. In cases where data sets included only counties, county data was crosswalked with metropolitan data. In cases where data sets included only states, the state where the largest portion of the metro is located was used.
The metrics used are as follows:
- Number of working musicians per 1,000 residents (11% weight)
- Median musician wage as a percentage of median overall wage (11% weight)
- Average price of concert tickets (11% weight)
- Monthly concert tickets as a percentage of median income (11% weight)
- Small concert venues within a 25-mile radius (11% weight)
- Music festivals within a 100-mile radius (11% weight)
- Google Trends data for the last 12 months for 20 different musical genres (33% total weight; 1.67% per genre)
Data sources include: US Census, Bureau of Economic Analysis, Bureau of Labor Statistics, Indie on the Move, Google Trends, SeatGeek, Music Genre List, and Music Festival Wizard.
Article Sources
About Clever
Since 2017, Clever Real Estate has been on a mission to make selling or buying a home easier and more affordable for everyone. 12 million annual readers rely on Clever's library of educational content and data-driven research to make smarter real estate decisions—and to date, Clever has helped consumers save more than $70 million on realtor fees. Clever's research has been featured in The New York Times, Business Insider, Inman, Housing Wire, and many more.
More Research From Clever


Frequently Asked Questions About Music Cities
What are the best music cities in the U.S.?
Nashville, Tenn., is the best overall city for music fans, with Indianapolis and Portland, Ore., close behind. The top 15 cities have an average of 3.9 small concert venues per capita, versus 2.9 venues per capita in the average city in our study. Learn more.
What is the music capital of America?
Home to 5x as many career musicians per capita (127) as the average U.S. city (28), Nashville, Tenn., is the No. 1 metro for music across the board. Learn more.
What are the best cities for live music?
Austin, Texas, is America's No. 1 live music metro, with an average of five concert venues per capita and nine music festivals planned for 2022 – almost 2x more than the average U.S. city (five)! Following close behind are New Orleans and Nashville, Tenn. Learn more.